Common input material
Paper PDFsMethods sectionsSample descriptionsVariable definitionsData sources
Papers rarely differ only in their conclusions — samples, variables, data sources and study design matter just as much. NuromBoard lays methodology out as comparison tables, cards and a research mind map.
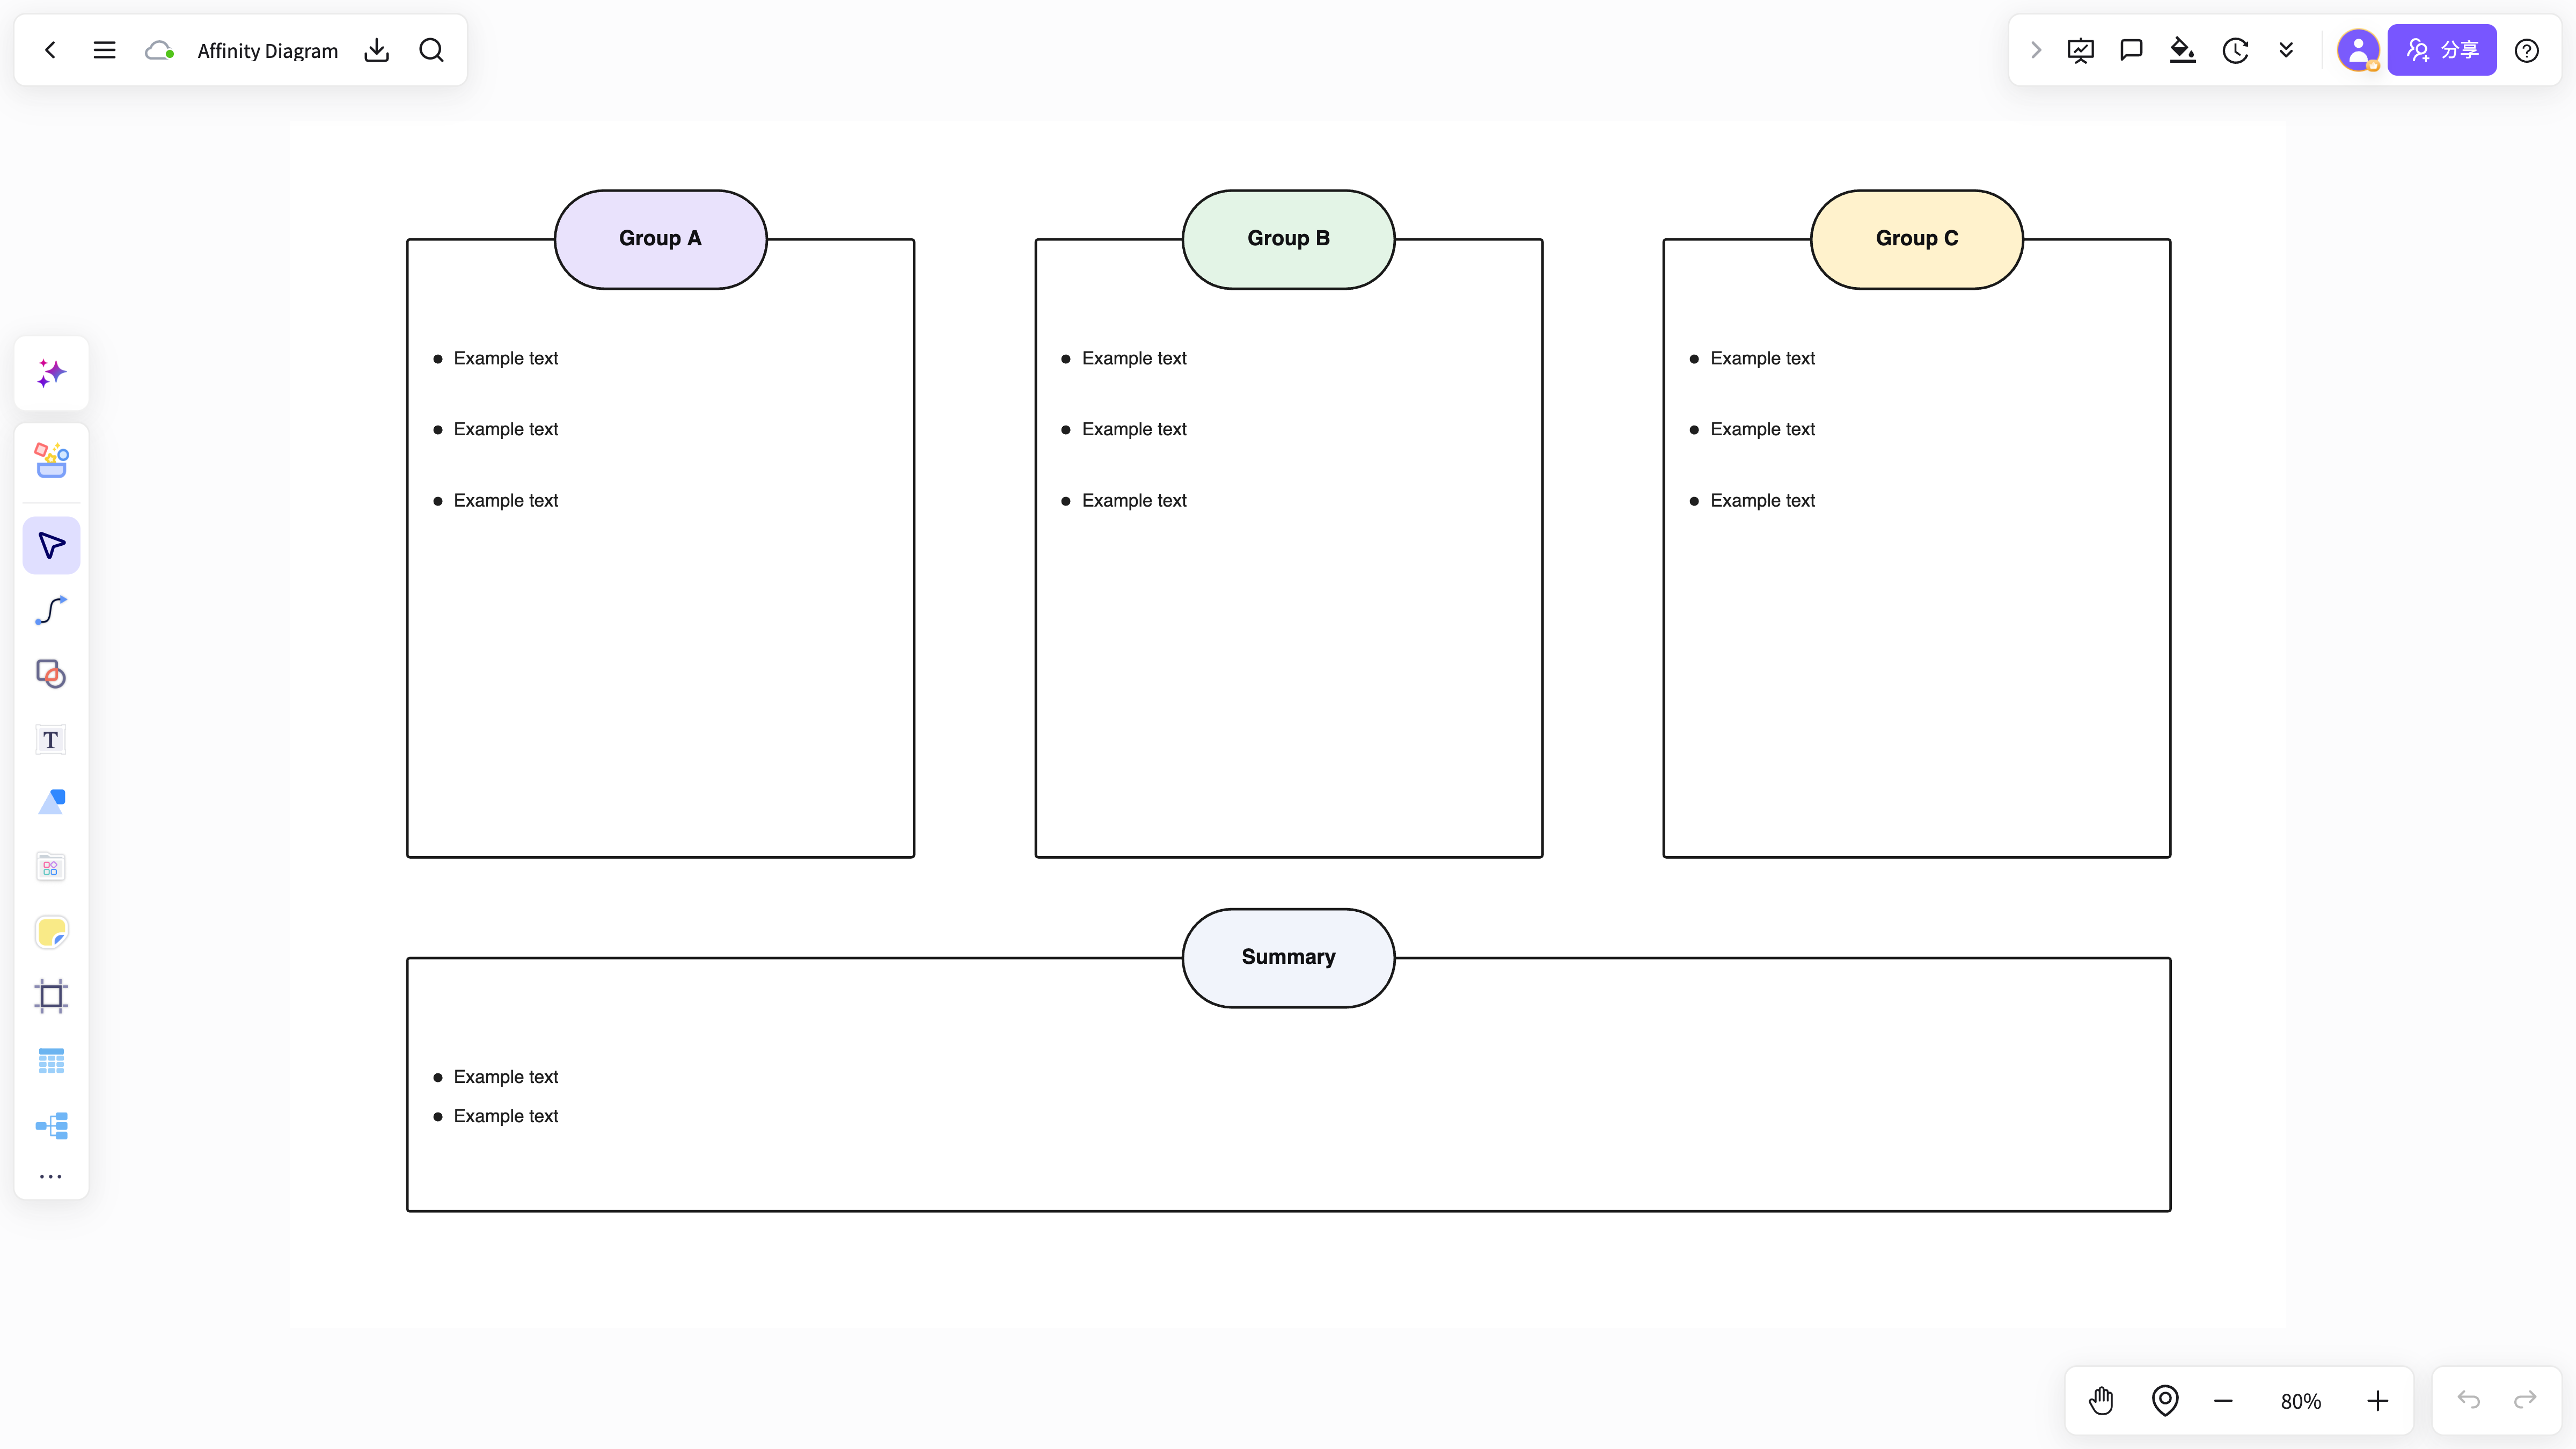
Findings from different methods and samples are not directly comparable.
Samples, variables, models and data sources are spread across paragraphs and tables.
Without shared dimensions it is hard to judge which method suits your own study.
Record the study object, sample, variables, method, data and limitations.
Compare the design of every paper using one shared set of fields.
Build the method comparison table, then connect it to a research map and review outline.
NuromBoard keeps method excerpts, cards and tables inside one research project.
The comparison feeds straight into proposals, literature reviews and research design write-ups.
Compare the method design of several papers side by side.
View and use the template →Organize samples, variables and data sources in one table.
View and use the template →The scenario page answers how the work starts; the method articles continue with the steps, the criteria, and where NuromBoard fits.
Include the study object, sample, variables, data source, method or model, key findings and limitations.
The table compares details across papers, while the research map shows themes, method routes and how the conclusions relate.